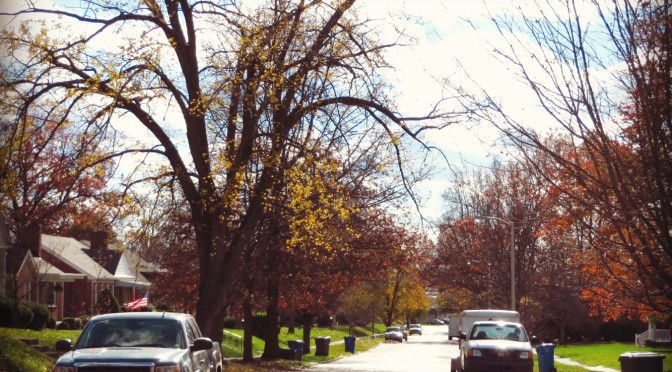
This walk took me to the Meadowthorpe neighborhood, the first planned neighborhood in Lexington. This area is historic and it appears well cared for even though homes in the area I walked through this time are modest. I feel that most 1950’s neighborhoods reflect the optimism of the period in which they were built, but it’s underneath a veneer of despair. This neighborhood is different. It still reflects that older 1950’s optimism, but it has retained or modified its optimism. It doesn’t feel dated, as its cohorts do, but instead feels as if it’s adapted its optimism to changing times.
Tag Archives: 40511
Day 99-Skeletons
[load]
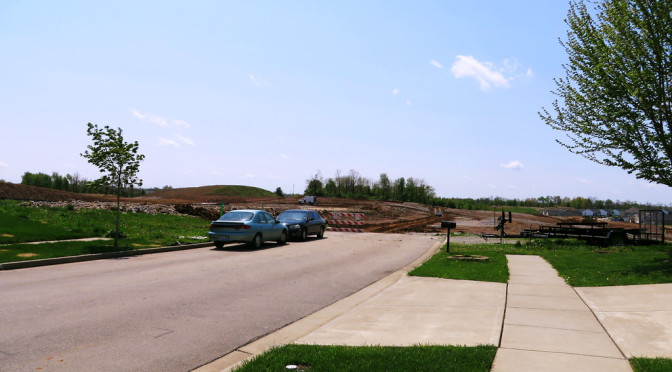
This was an entertaining walk through a neighborhood that is still being built out. In addition to gaps between houses, lots that haven’t been built on yet, preparations are underway for the next addition to the subdivision to the south. Its nice to get a peek at the skeleton of the city under construction. In this case it appears that existing streets are generally to be extended to the south. (This confirms the story told by the current map of the city, and discussed a few days back, on Day 91).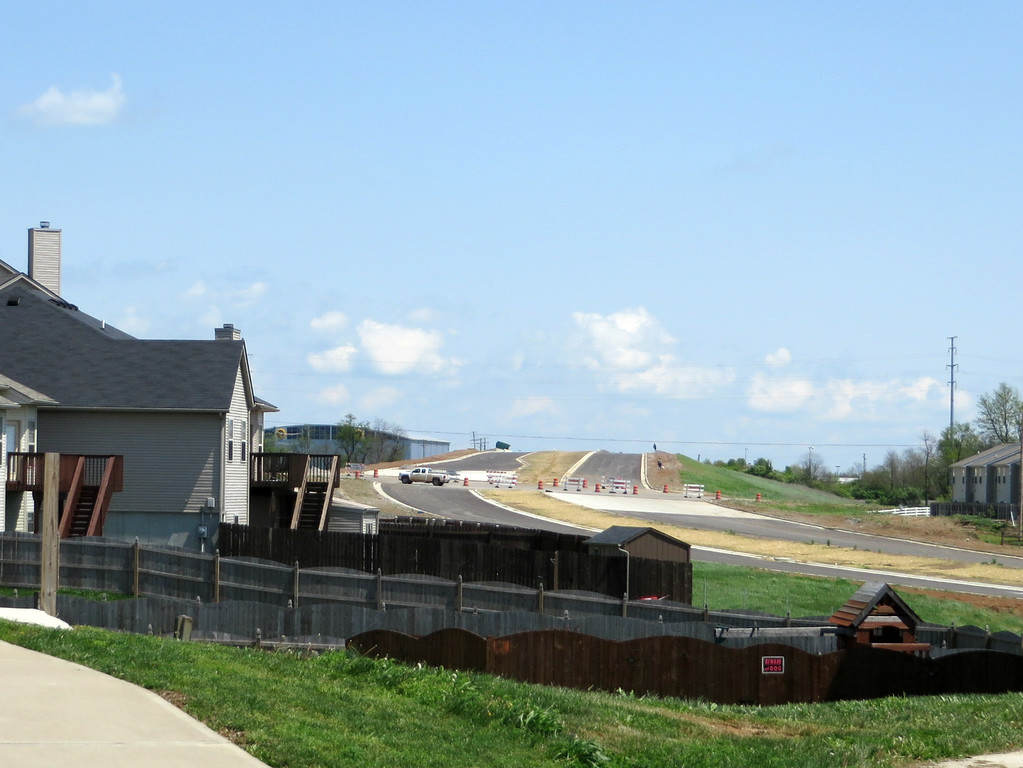
The new Citation Road is also visible from this subdivision, just west of where it crosses Greendale Road. Citation Road is being managed by the Kentucky Transportation Cabinet, which has has details on the project.
Day 91-Planning ahead
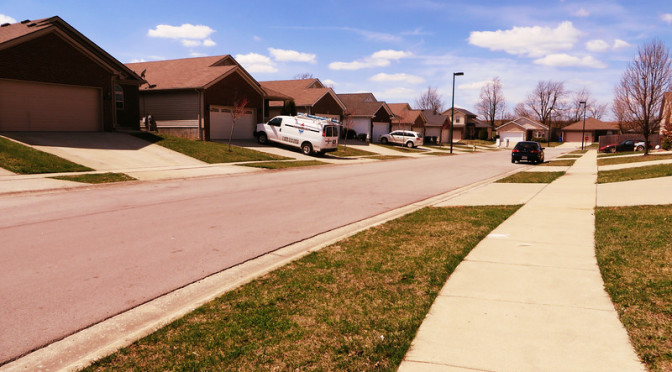
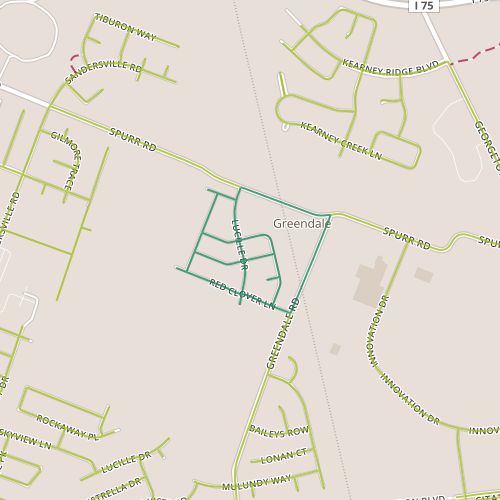 Today I visited Garden Meadows, a little self-contained subdivision located along Spurr Road and Greendale road near Georgetown Road. This is a newer neighborhood and shows some similarities to other newer neighborhoods on this side of the city, particularly a move away from straight cul-de-sacs and toward a slightly more connected network. This neighborhood features a street, Lucille, that pops up further south and it appears the intent is to connect it eventually. I’m coming to believe that a well-connected grid is essential to any true walkability and glad to see that good connections between neighborhoods are being designed in ahead of time.
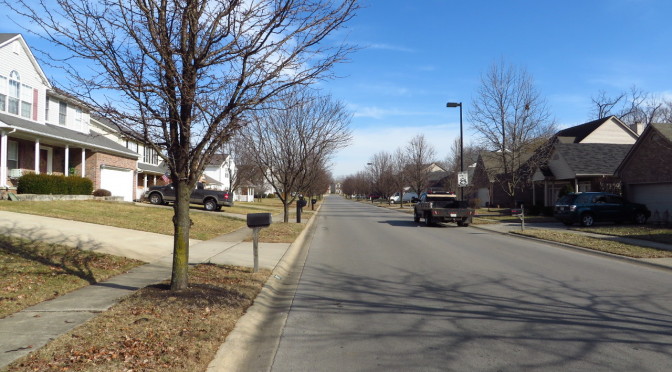
Day 82-More new houses
Today, I visited the Masterson Station neighborhood. The area I visited today dates from the mid- to late- 1990s, with houses a little larger than average. The area is fairly typical, in terms of architecture, topology, landscaping, of similarly aged neighborhoods. I liked Masterson Station Drive, which serves as a minor collector road. Unlike similar streets in similar neighborhoods, Masterson Station Drive is narrower and has a lower speed limit. It’s more pleasant to walk down and you don’t have to pity those residents of the street who have to pull out onto the road every morning during rush hour.
It seems like there is a surprisingly large number of houses from the 1990s and 2000s in Lexington. Growth, and especially exponential growth has the ability to do weird things. Lexington’s population grew from 225,000 people in 1990 to 308,000 people in 2013, a nearly 37% increase over that time. It wouldn’t be unreasonable to expect total housing units to increase by a similar amount over that period, which would mean that nearly a quarter of all housing units available in 2013 were built since 1990, even without some attrition of older housing.
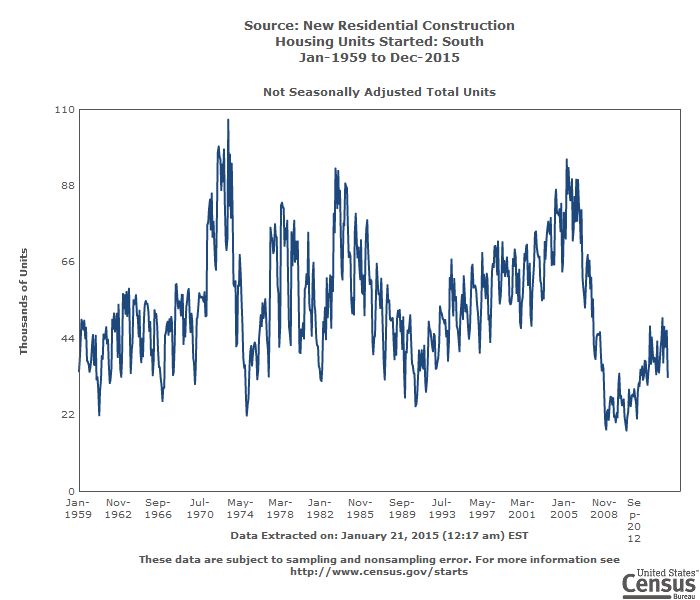
In reality, the situation is a little more complicated, and housing starts are not solely driven by population. Census data for the South shows that housing starts increased fairly steadily over the 1990s and 2000s, peaking before the housing crisis and then declining rapidly. The data isn’t granular and can’t be explored at the level of metropolitan area but I imagine this story is familiar–boom and bust. The net impact though may be to confirm my impression that an awful lot of houses (perhaps too many!) were built during the 90s and 00s.
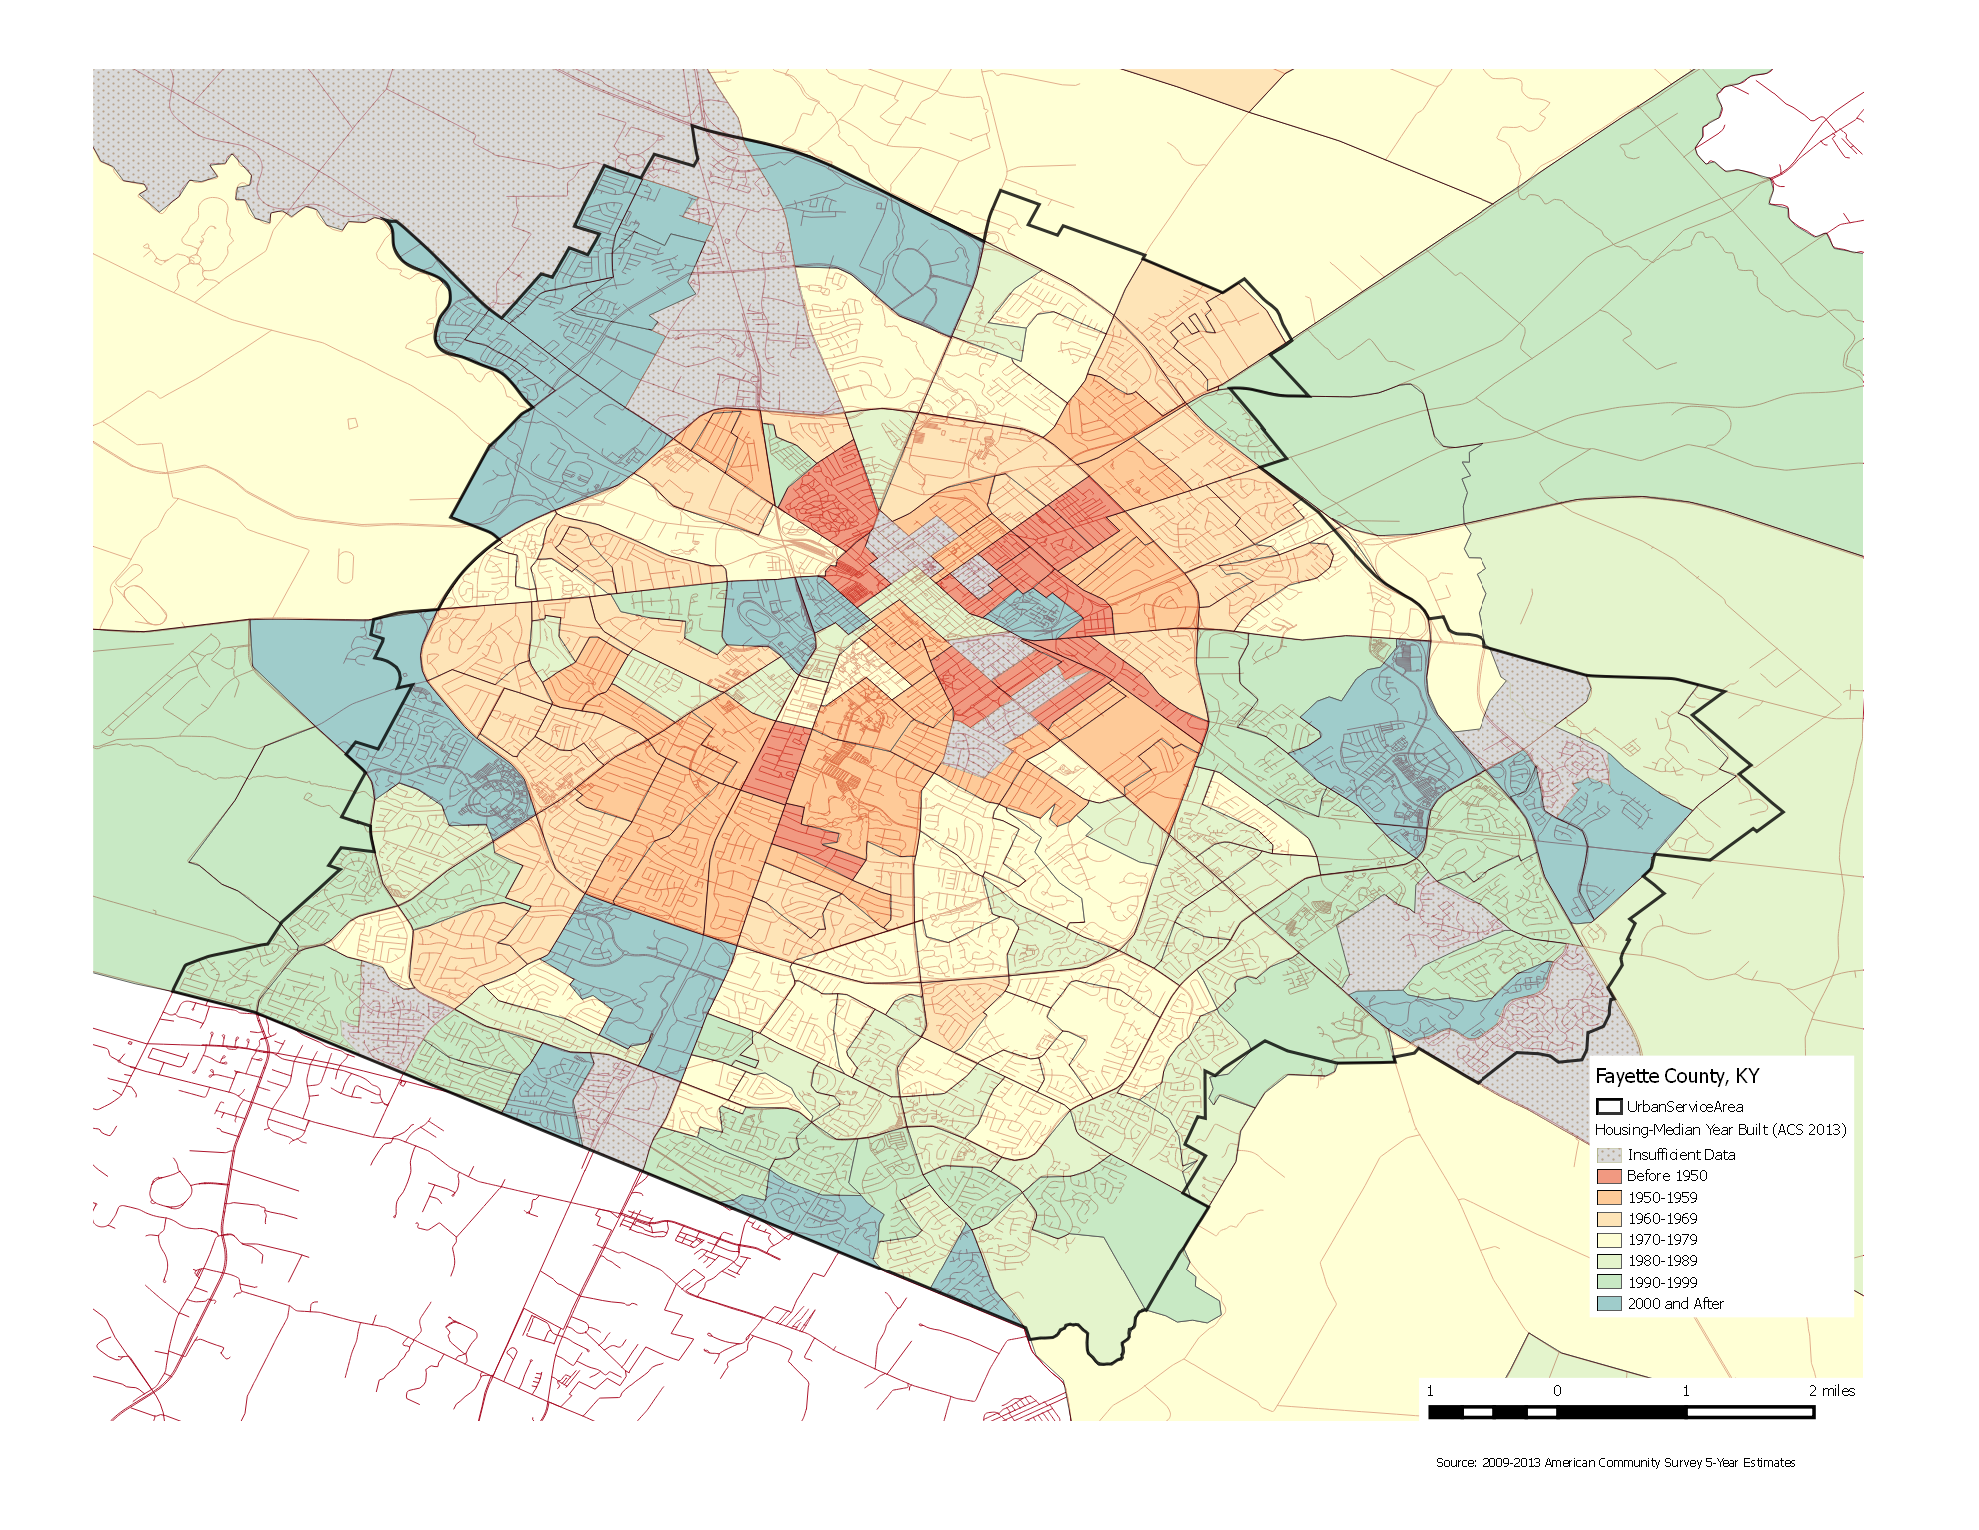
 I wanted to visualize housing age in a different way, mapping neighborhood age. Census data on housing includes median year built at the census block level. (Census tracts are the base level at which the census reports population data; census blocks are subdivisions of tracts, though in many cases they are the same.) I sorted the data into bins by decade and then mapped them. There are problems with this representation. It doesn’t show margin of error which in some areas can be significant. It also doesn’t account for density, so while newer areas dominate in terms of area, it’s impossible to draw any conclusion about quantity of housing in any area. Still, it does provide some insights. New Circle Road appears to have been a fairly hard edge for development. Infill development like that in the East End (see Day 11) stands out.
Day 78-Suburban Street Grid
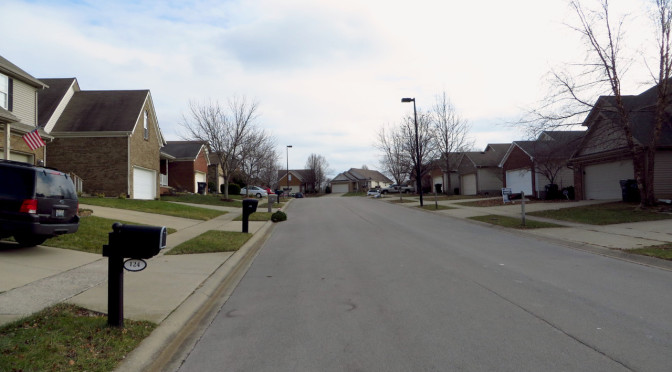
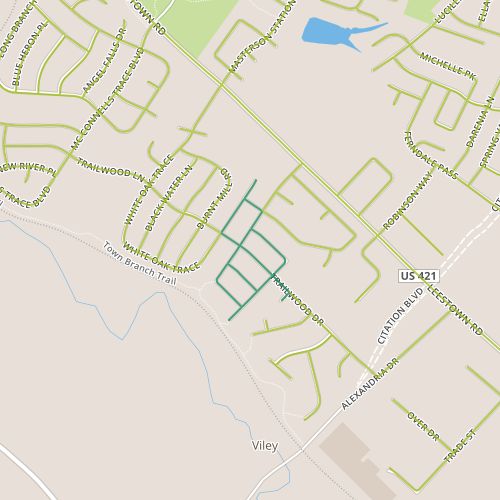 Today’s walk was through an area just southwest of Leestown Road near Masterston Station Park. This appears to be three separate subdivisions, though the bulk of today’s path was in the Spicewood subdivision. This portion was built out in the early 2000s. Even though the surrounding areas seem to generally be of a similar age, the area immediately northwest of Spicewood is currently still building and there are a string of undeveloped lots on White Oak. One of the nice features of this area is that it has two connection points to the Town Branch trail.

I was also happy to see that this subdivision and many of its neighbors have moved away from the cul-de-sac philosophy. Instead of many dead end streets, each street connects to multiple other streets. One of the benefits is that the distance between two points is likely to be closer relative to two similar points in a cul-de-sac neighborhood, which is especially nice when one of the things you might want to walk to is a trail.